Monitoring
Corda Namespace Dashboard
To access you Catalyst Blockchain Manager - Corda Namespace Dashboard, navigate to the Dashboard section through the Catalyst console side menu.
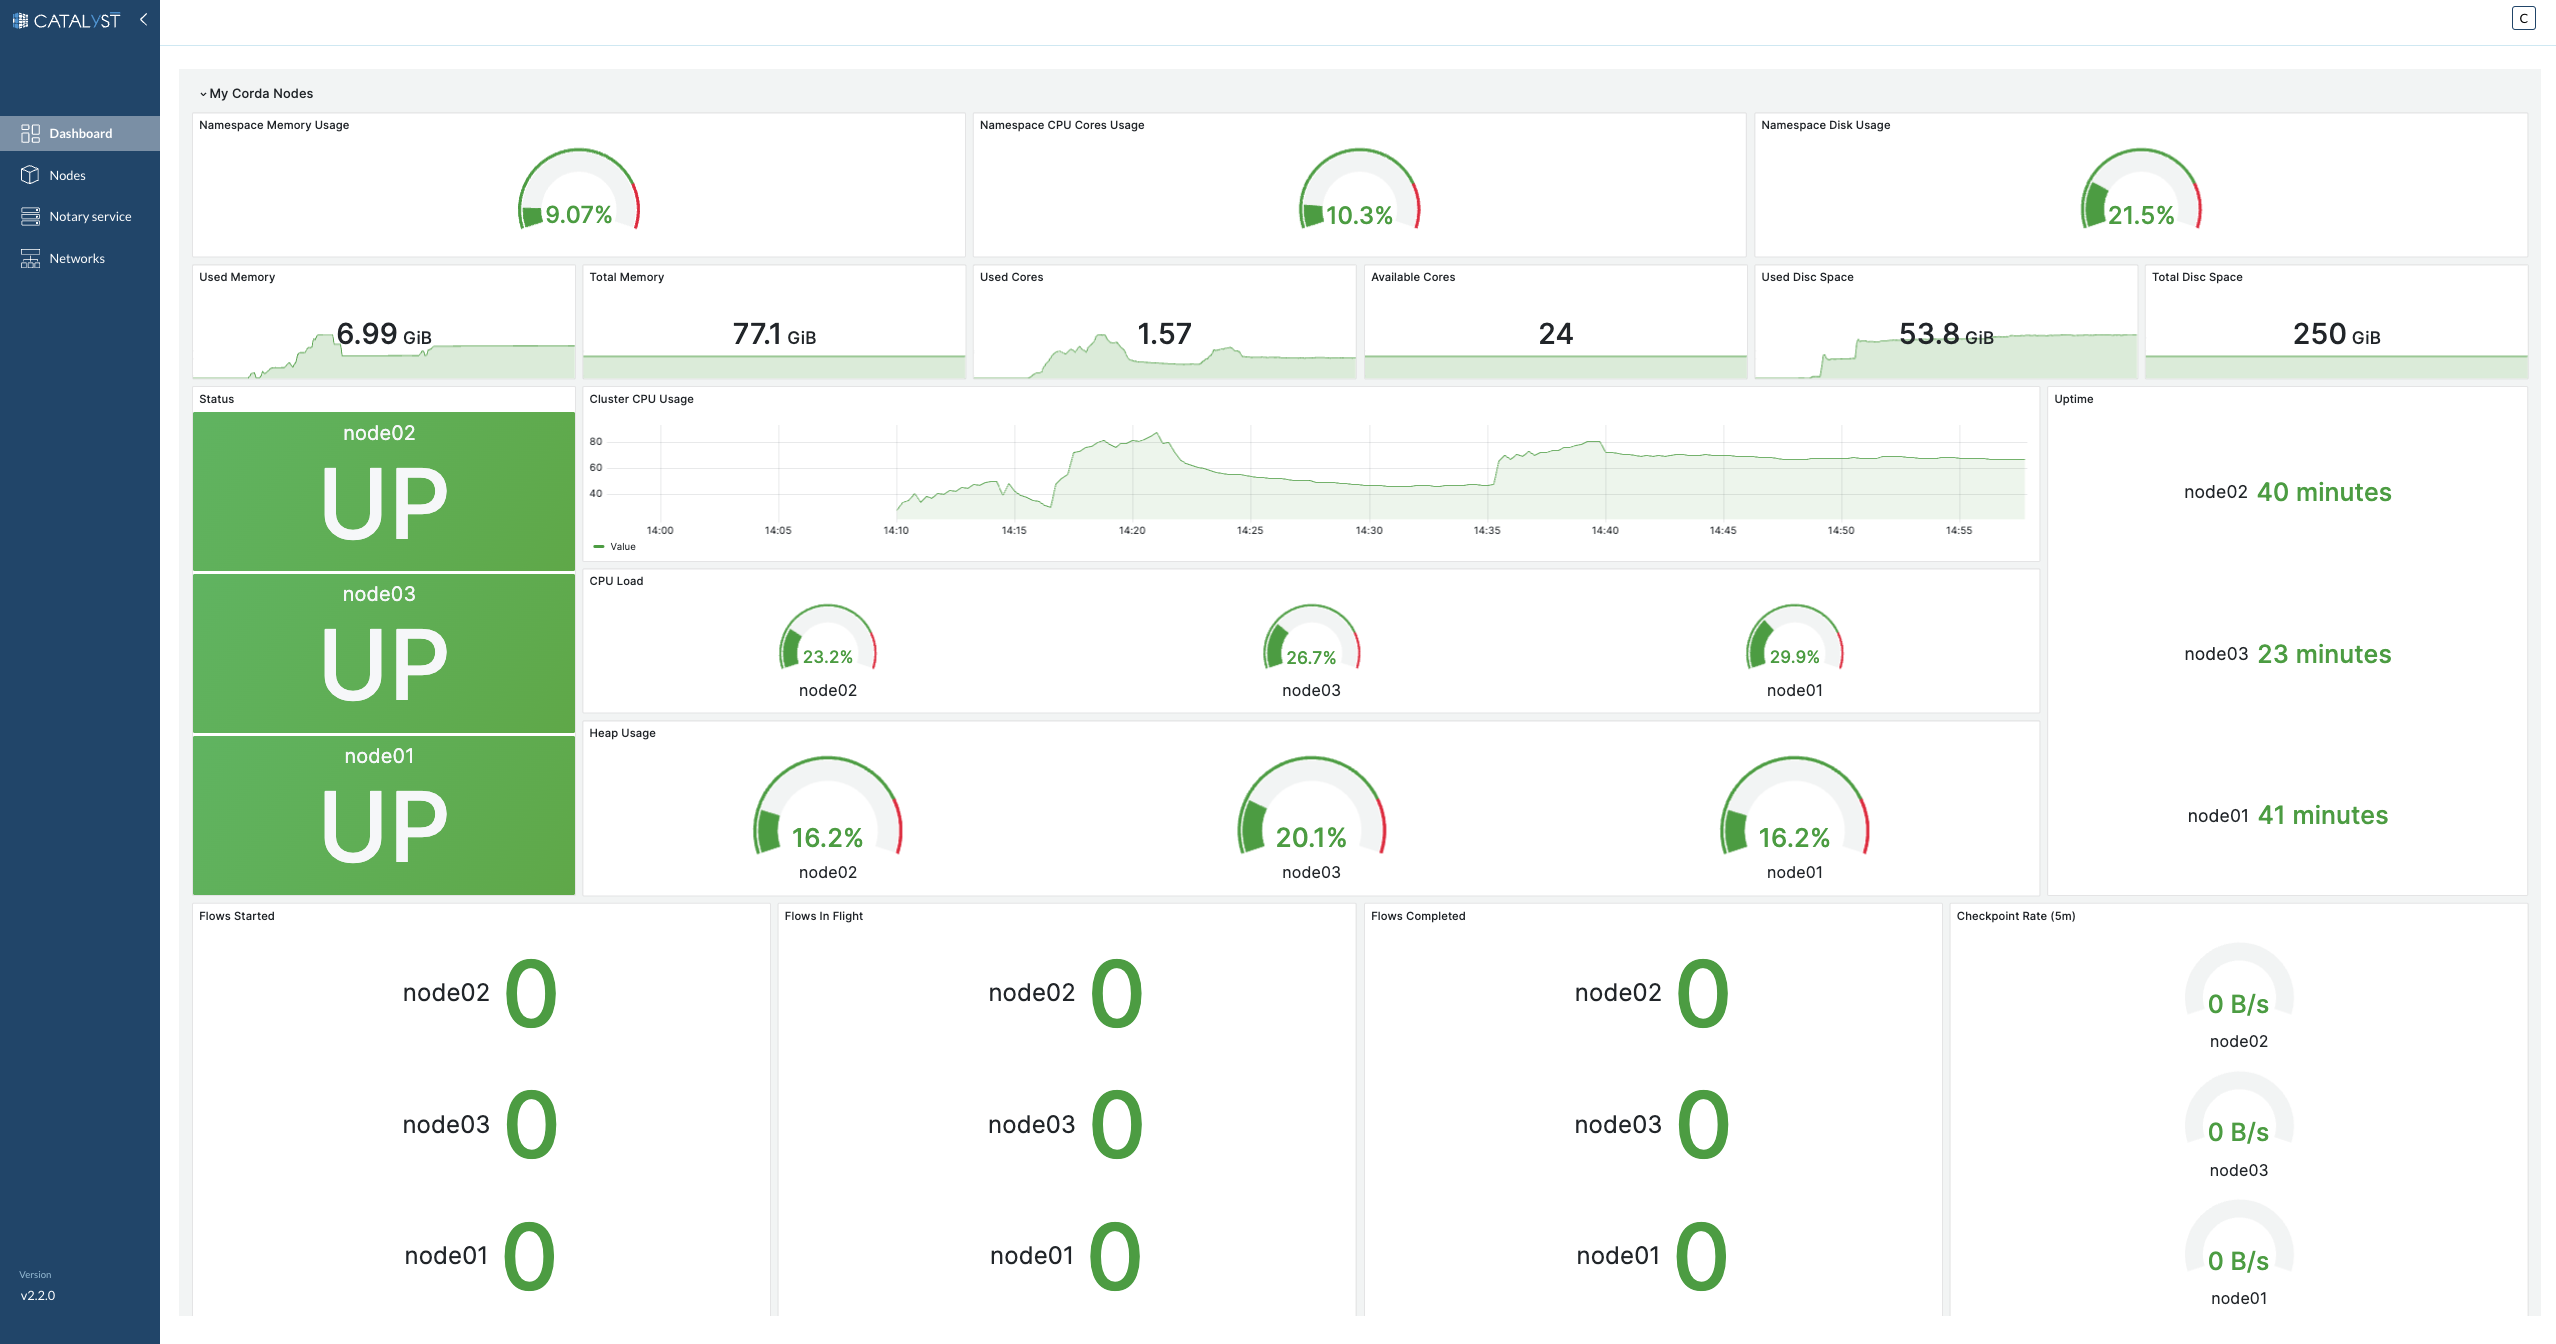
Our comprehensive Monitoring Dashboard provides a real-time overview of system performance and health across various components. It’s designed to give you a snapshot of the critical metrics and statuses you need to ensure the smooth operation of your Corda Nodes. Here’s what you’ll find in the dashboard:
Namespace Memory Usage
-
Used Memory: Visual gauge and trend graph showing the current memory consumption.
-
Total Memory: Display of the total allocated memory for the namespace.
Namespace CPU Cores Usage
-
Used Cores: Gauge and trend graph for the number of CPU cores in use.
-
Available Cores: Total count of CPU cores available to the namespace.
Namespace Disk Usage
-
Used Disk Space: Visual indicator and historical graph of the disk space utilized.
-
Total Disk Space: The total capacity of disk space allocated for the namespace.
Node Status
-
Indicates the operational status of each node, clearly showing whether it is 'UP' and running.
Heap Usage Per Node
-
Displays the heap memory usage as a percentage, allowing for quick assessment of each node’s memory heap utilization.
Flows Metrics
-
Flows Started: Counters for the number of new flows initiated by each node.
-
Flows In Flight: Ongoing flow processes that are currently active for each node.
-
Flows Completed: The tally of flows that each node has successfully processed.
-
Checkpoint Rate (5m): The rate at which checkpoints are being created in the system, measured over a 5-minute average for each node.
Corda Node Dashboard
To access the Corda Node Dashboard, navigate to the Nodes section through the Catalyst console side menu, Access your node by clicking on it and Click on the Dashboard tab.
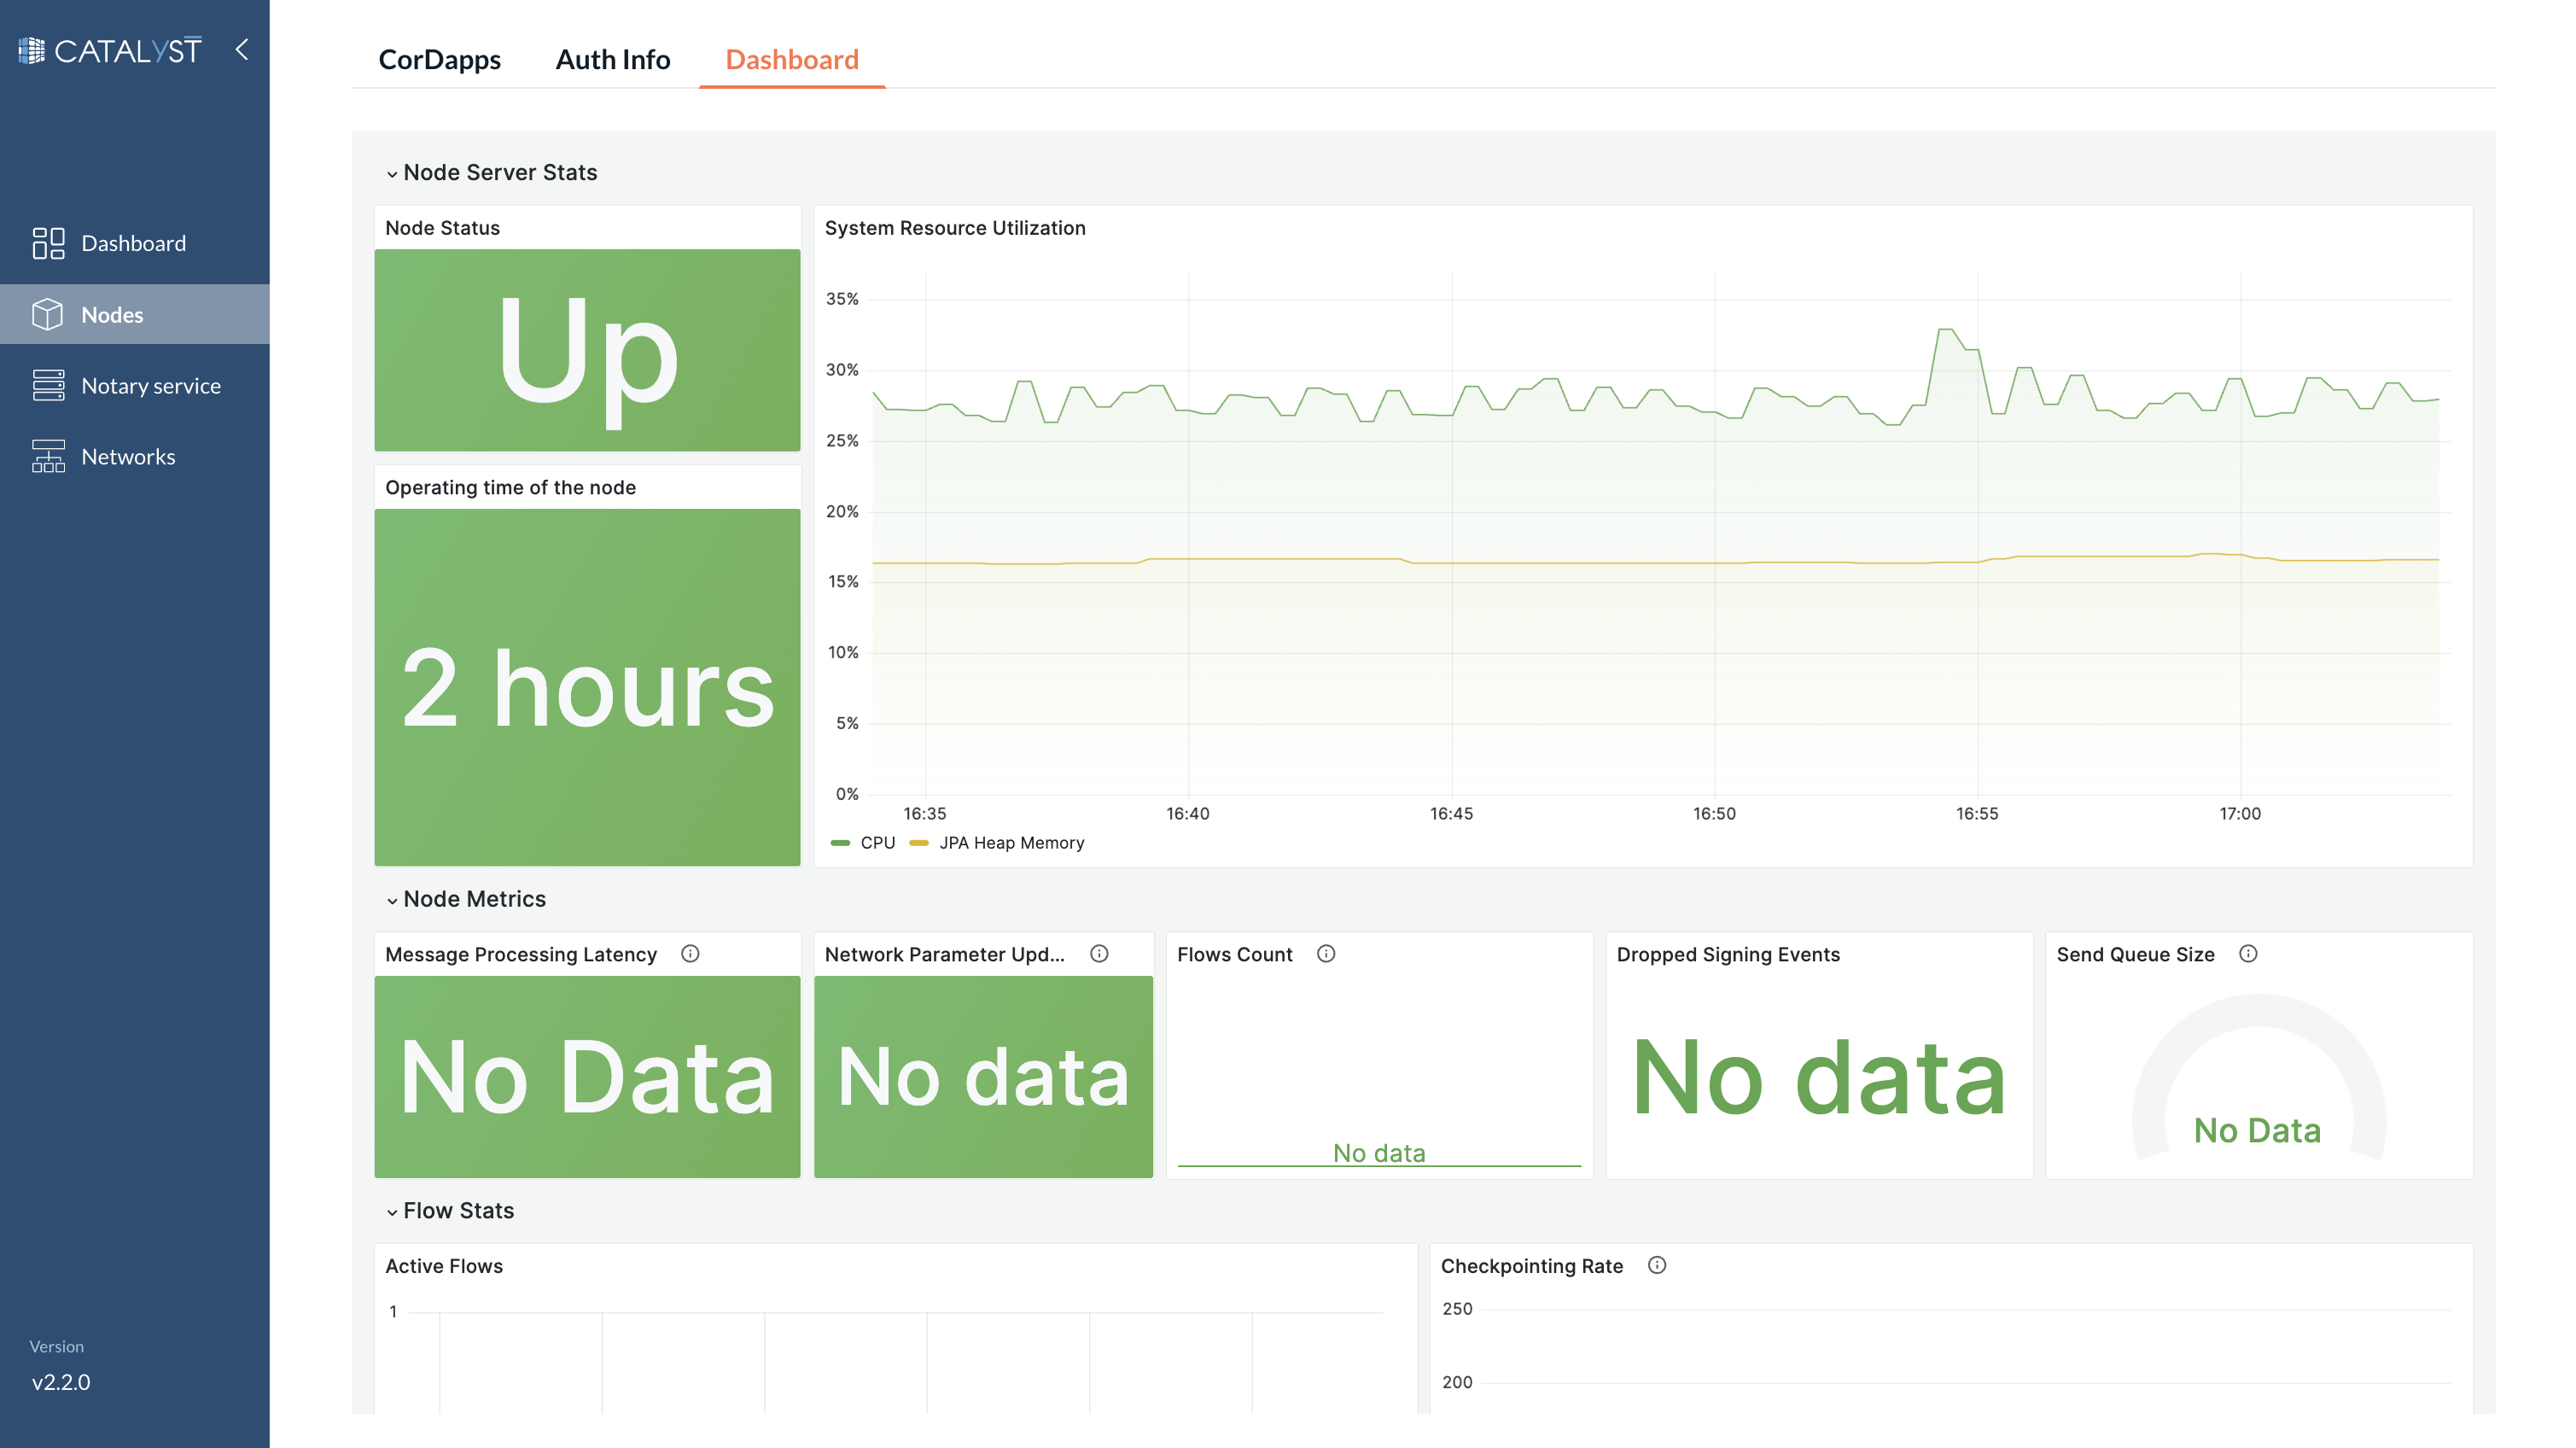
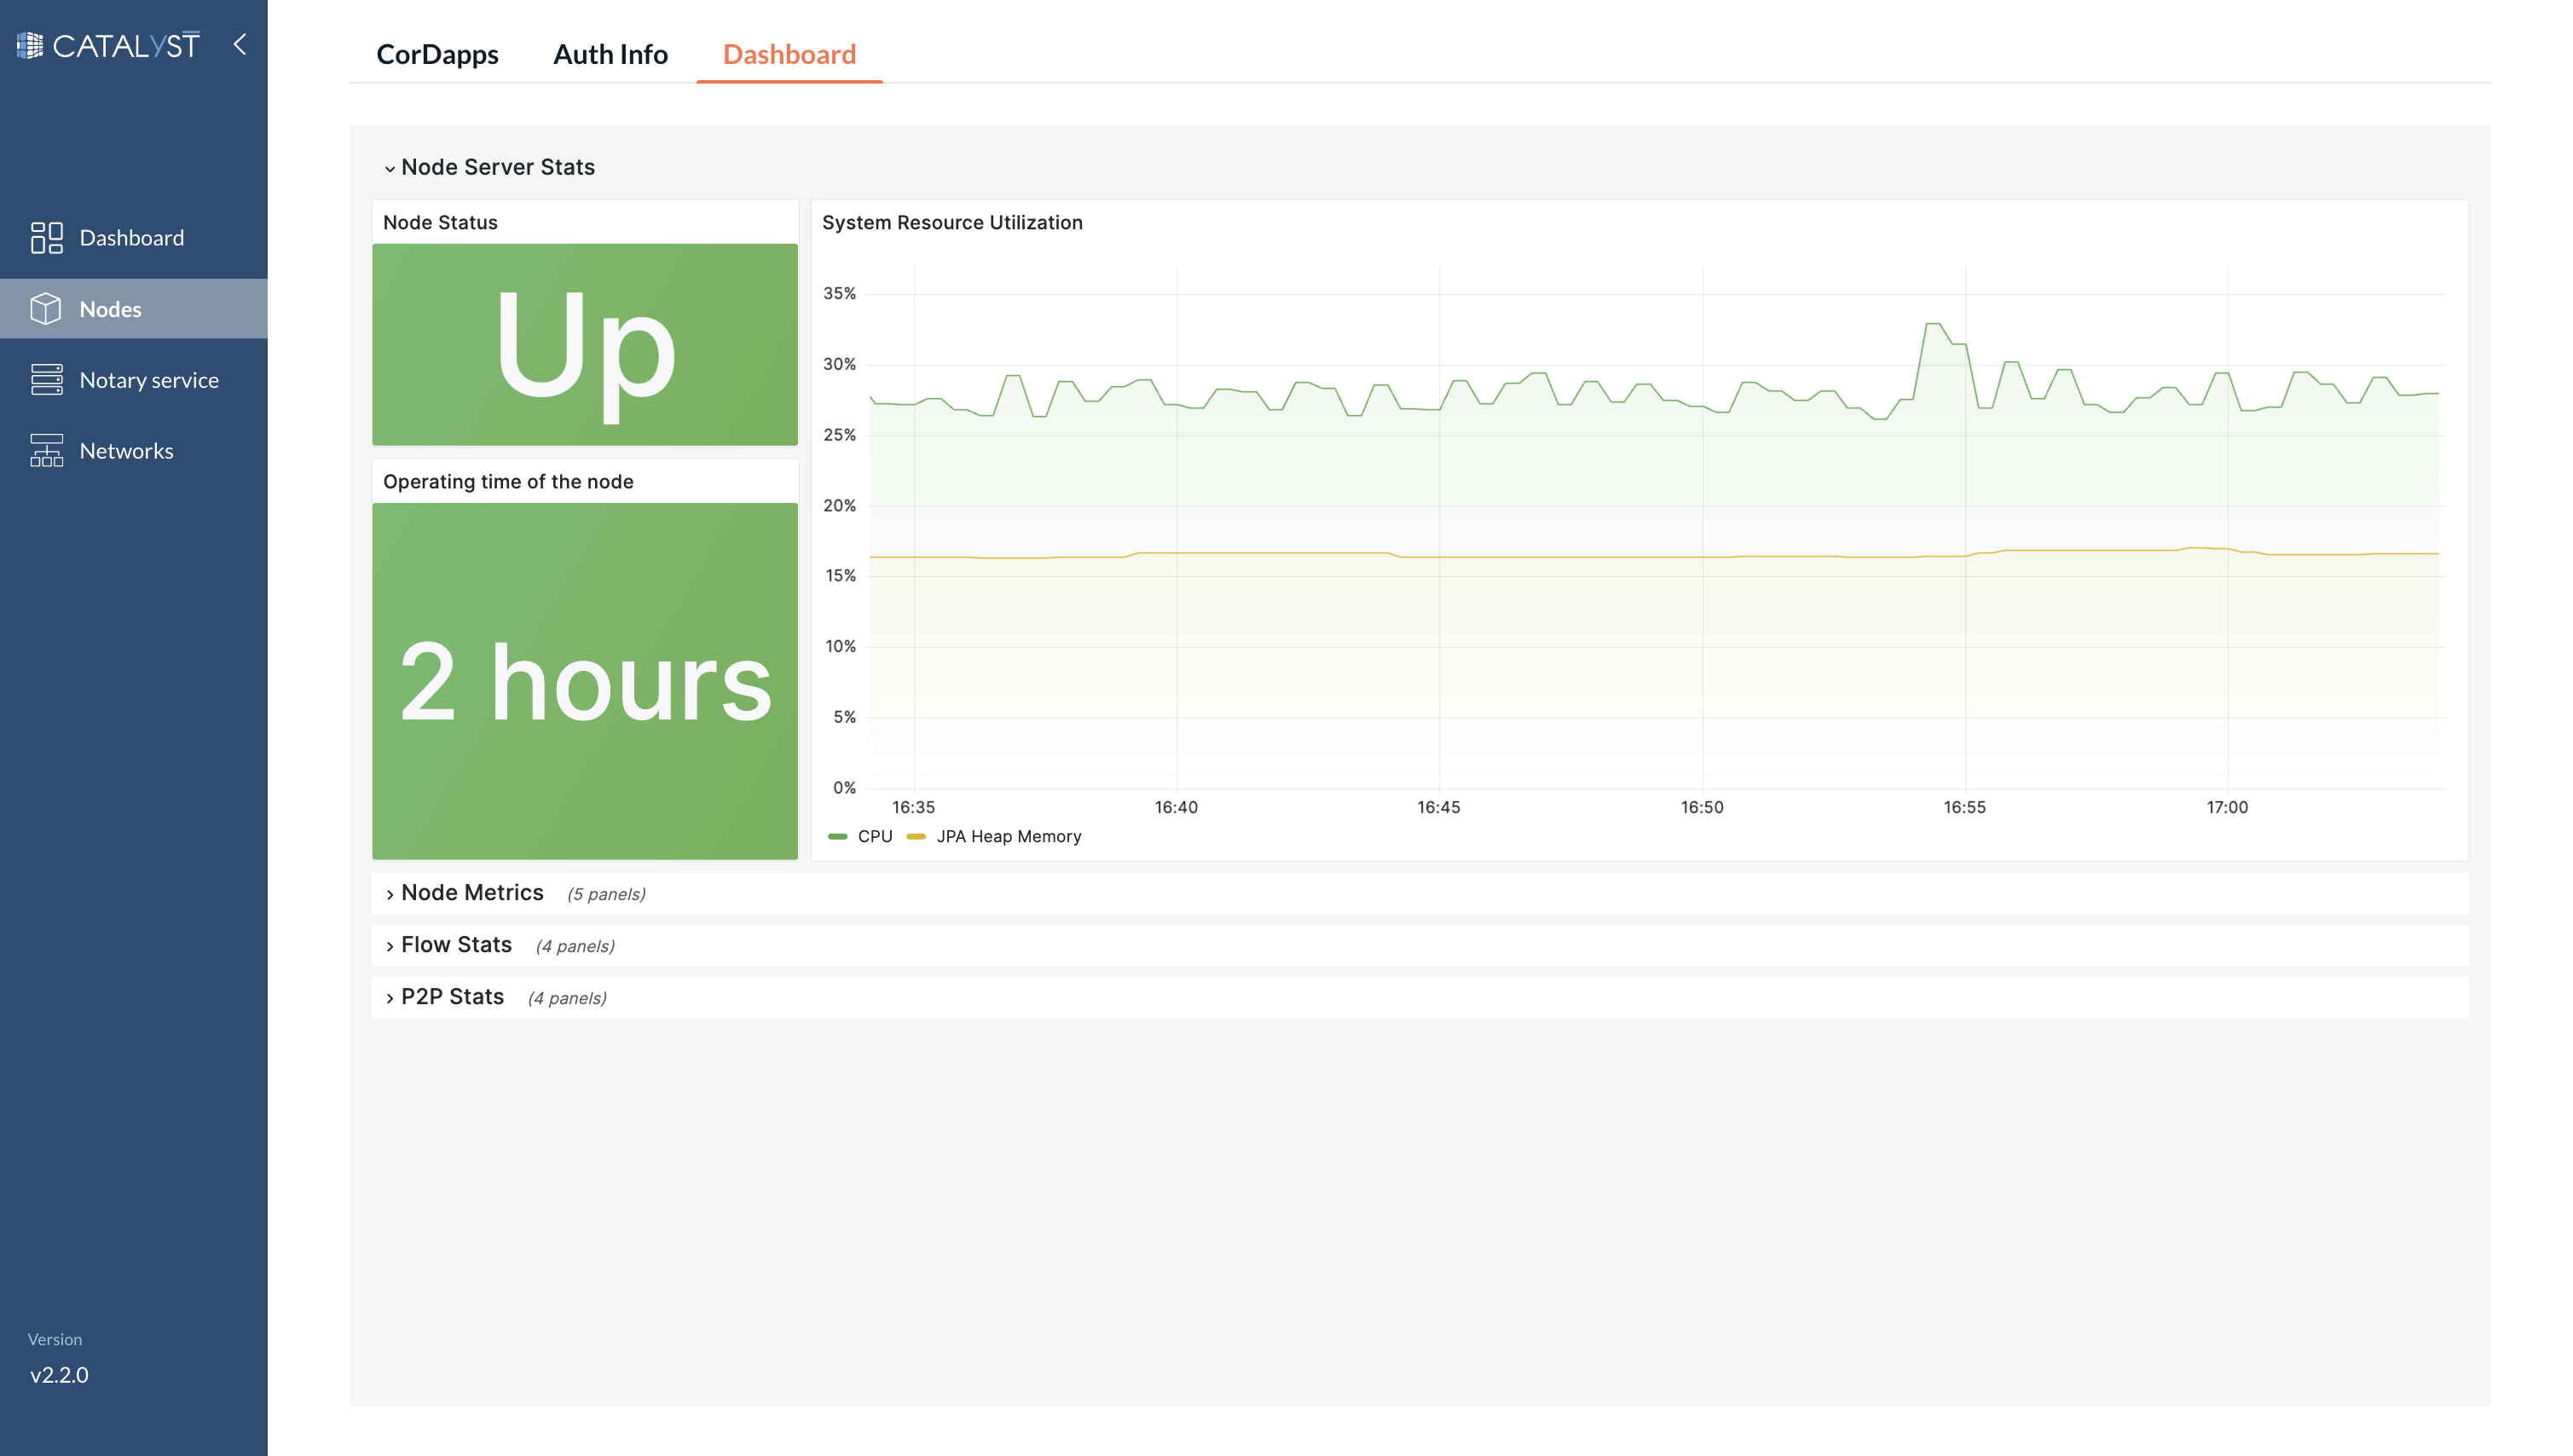
The Corda Node Dashboard offers a detailed view of a single node’s performance and operational statistics. This dashboard is tailored to provide administrators and users with in-depth insights into the functioning and efficiency of an individual node within the network. Here’s a breakdown of the metrics available:
Node Server Stats
-
Node Status: Real-time status indicator to confirm if the node is active and operational.
-
Operating Time: Displays the duration for which the node has been running without interruption.
-
System Resource Utilization: Comprehensive metrics on the node’s consumption of system resources including CPU, memory, and disk usage.
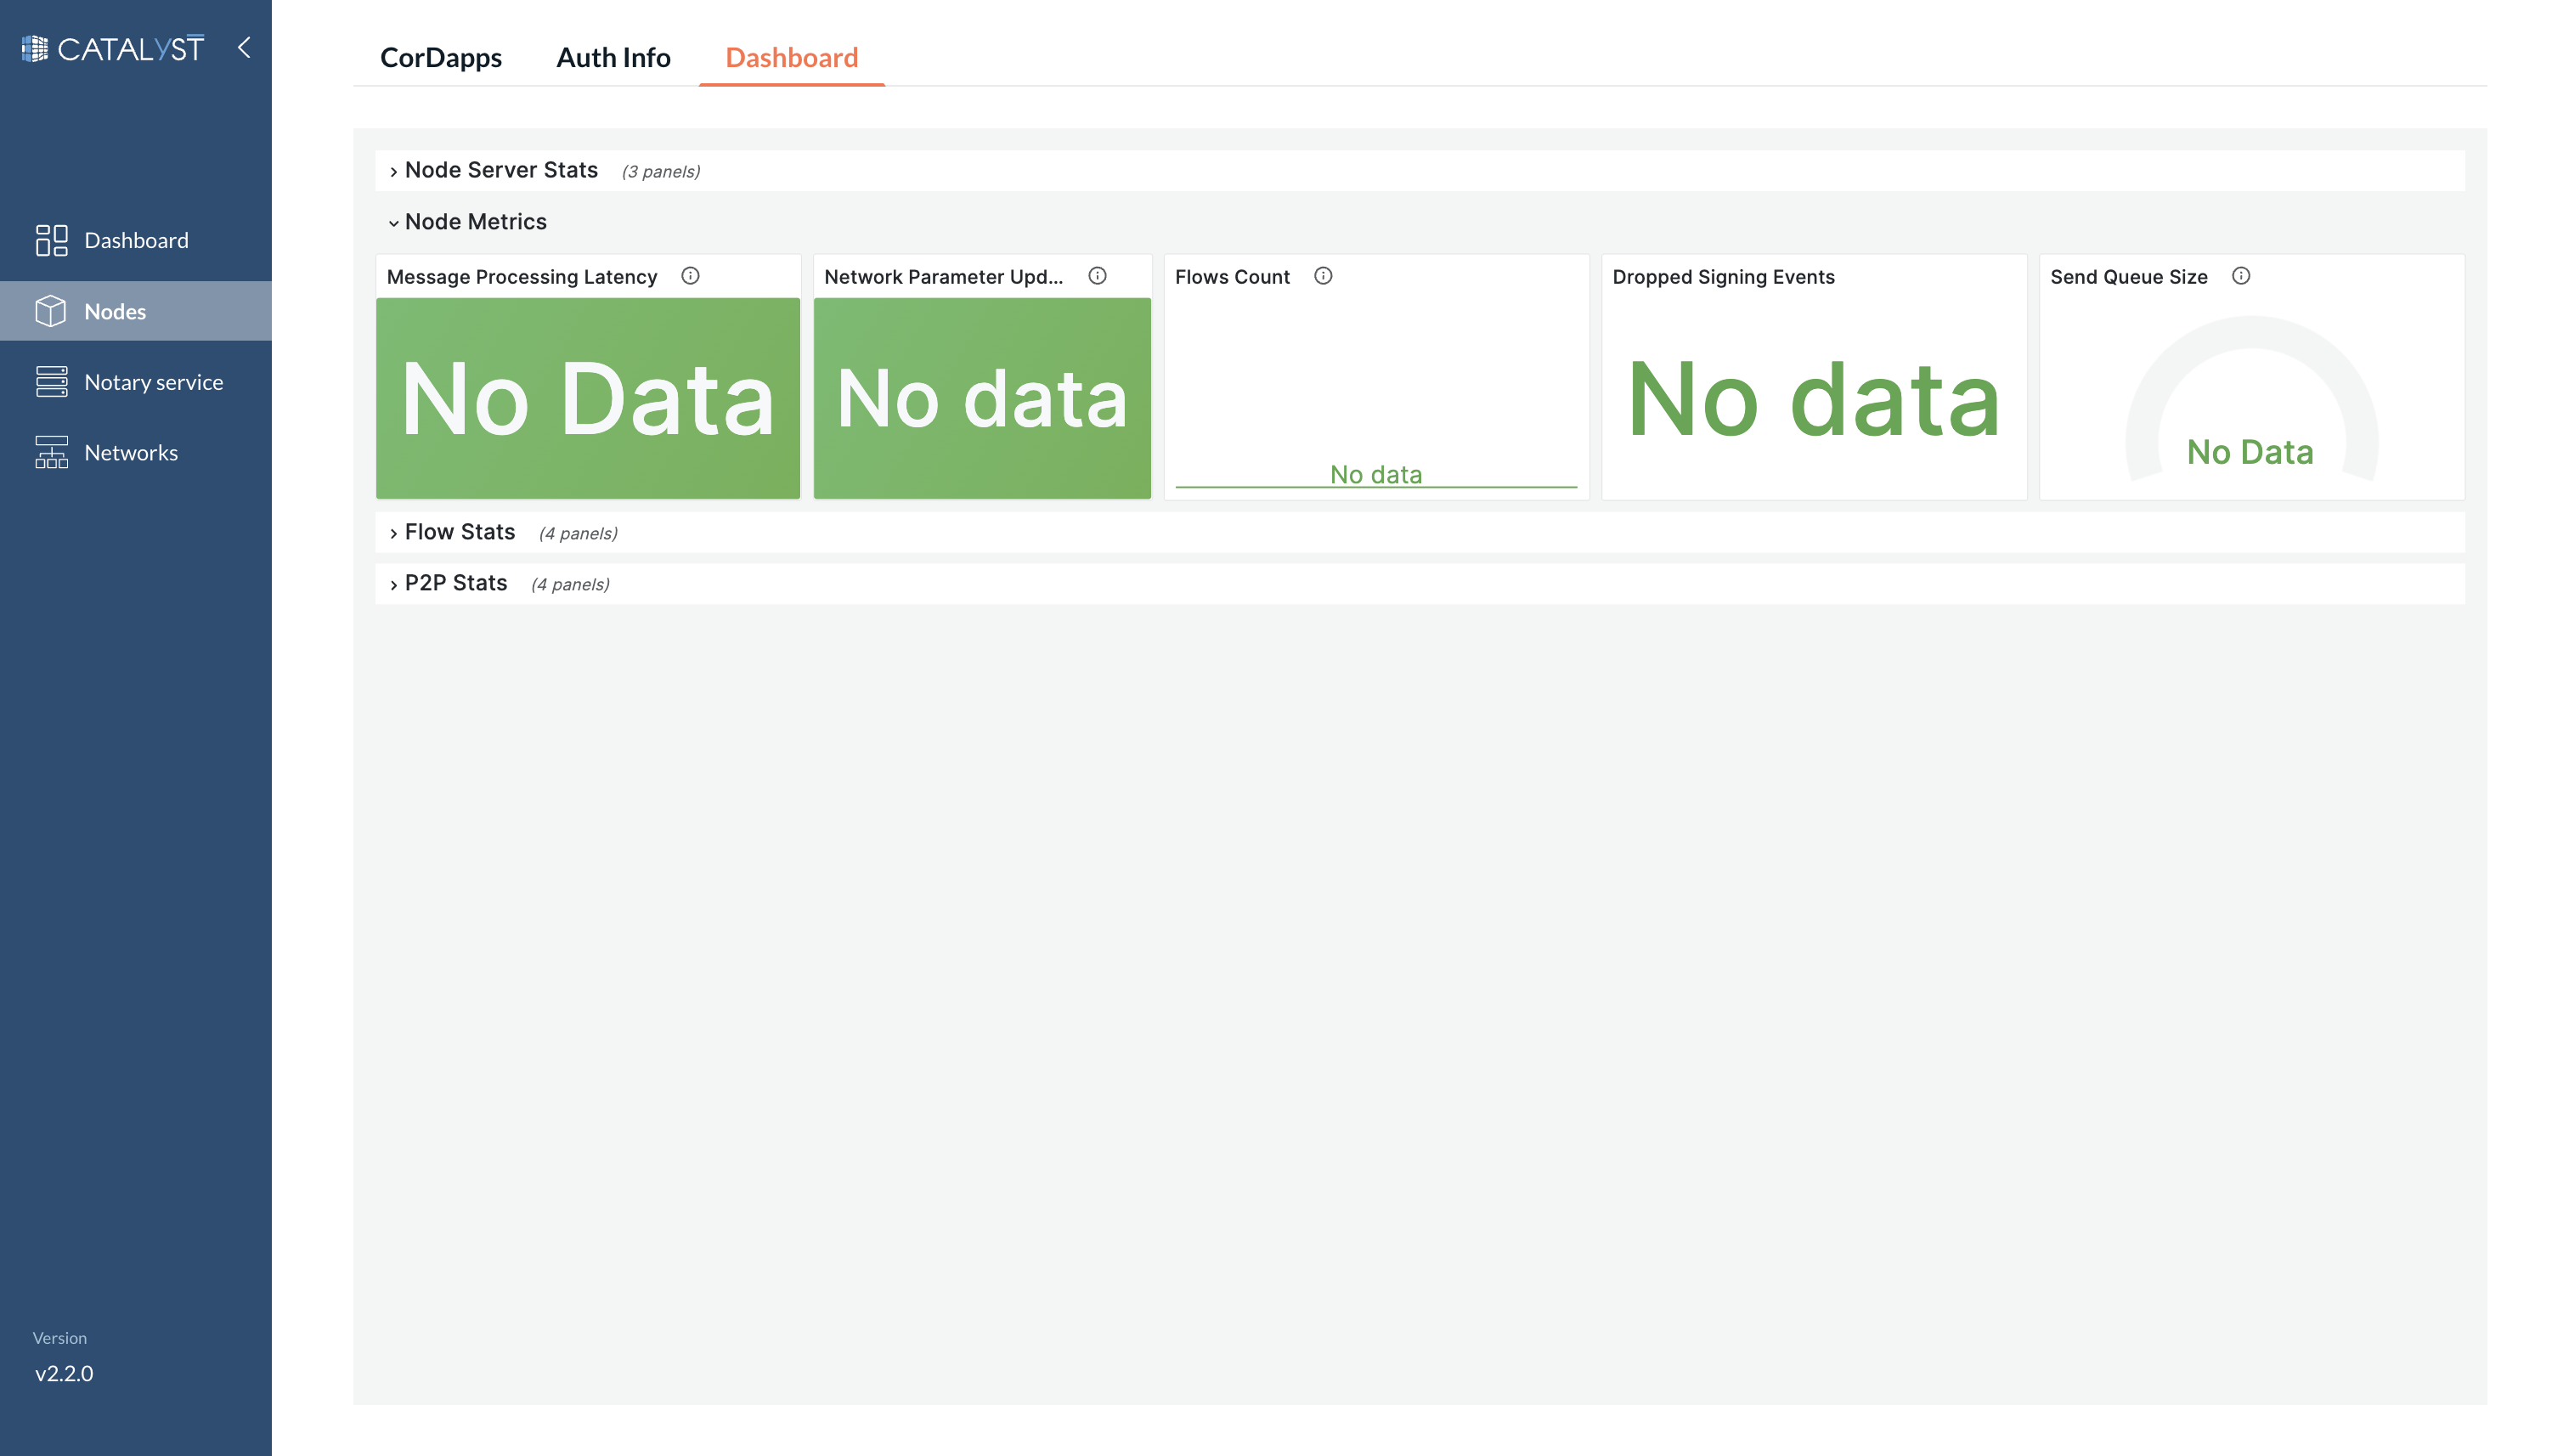
Node Metrics
-
Message Processing Latency: Measures the time taken to process messages, providing insights into the node’s performance.
-
Network Parameter Update: Status of the most recent network parameter updates.
-
Flows Count: The total number of flow processes initiated, in progress, or completed.
-
Dropped Signing Events: Tracks the number of signing events that have failed or been rejected.
-
Send Queue Size: Displays the current size of the send queue, indicating the volume of outgoing messages awaiting processing.
Flow Stats
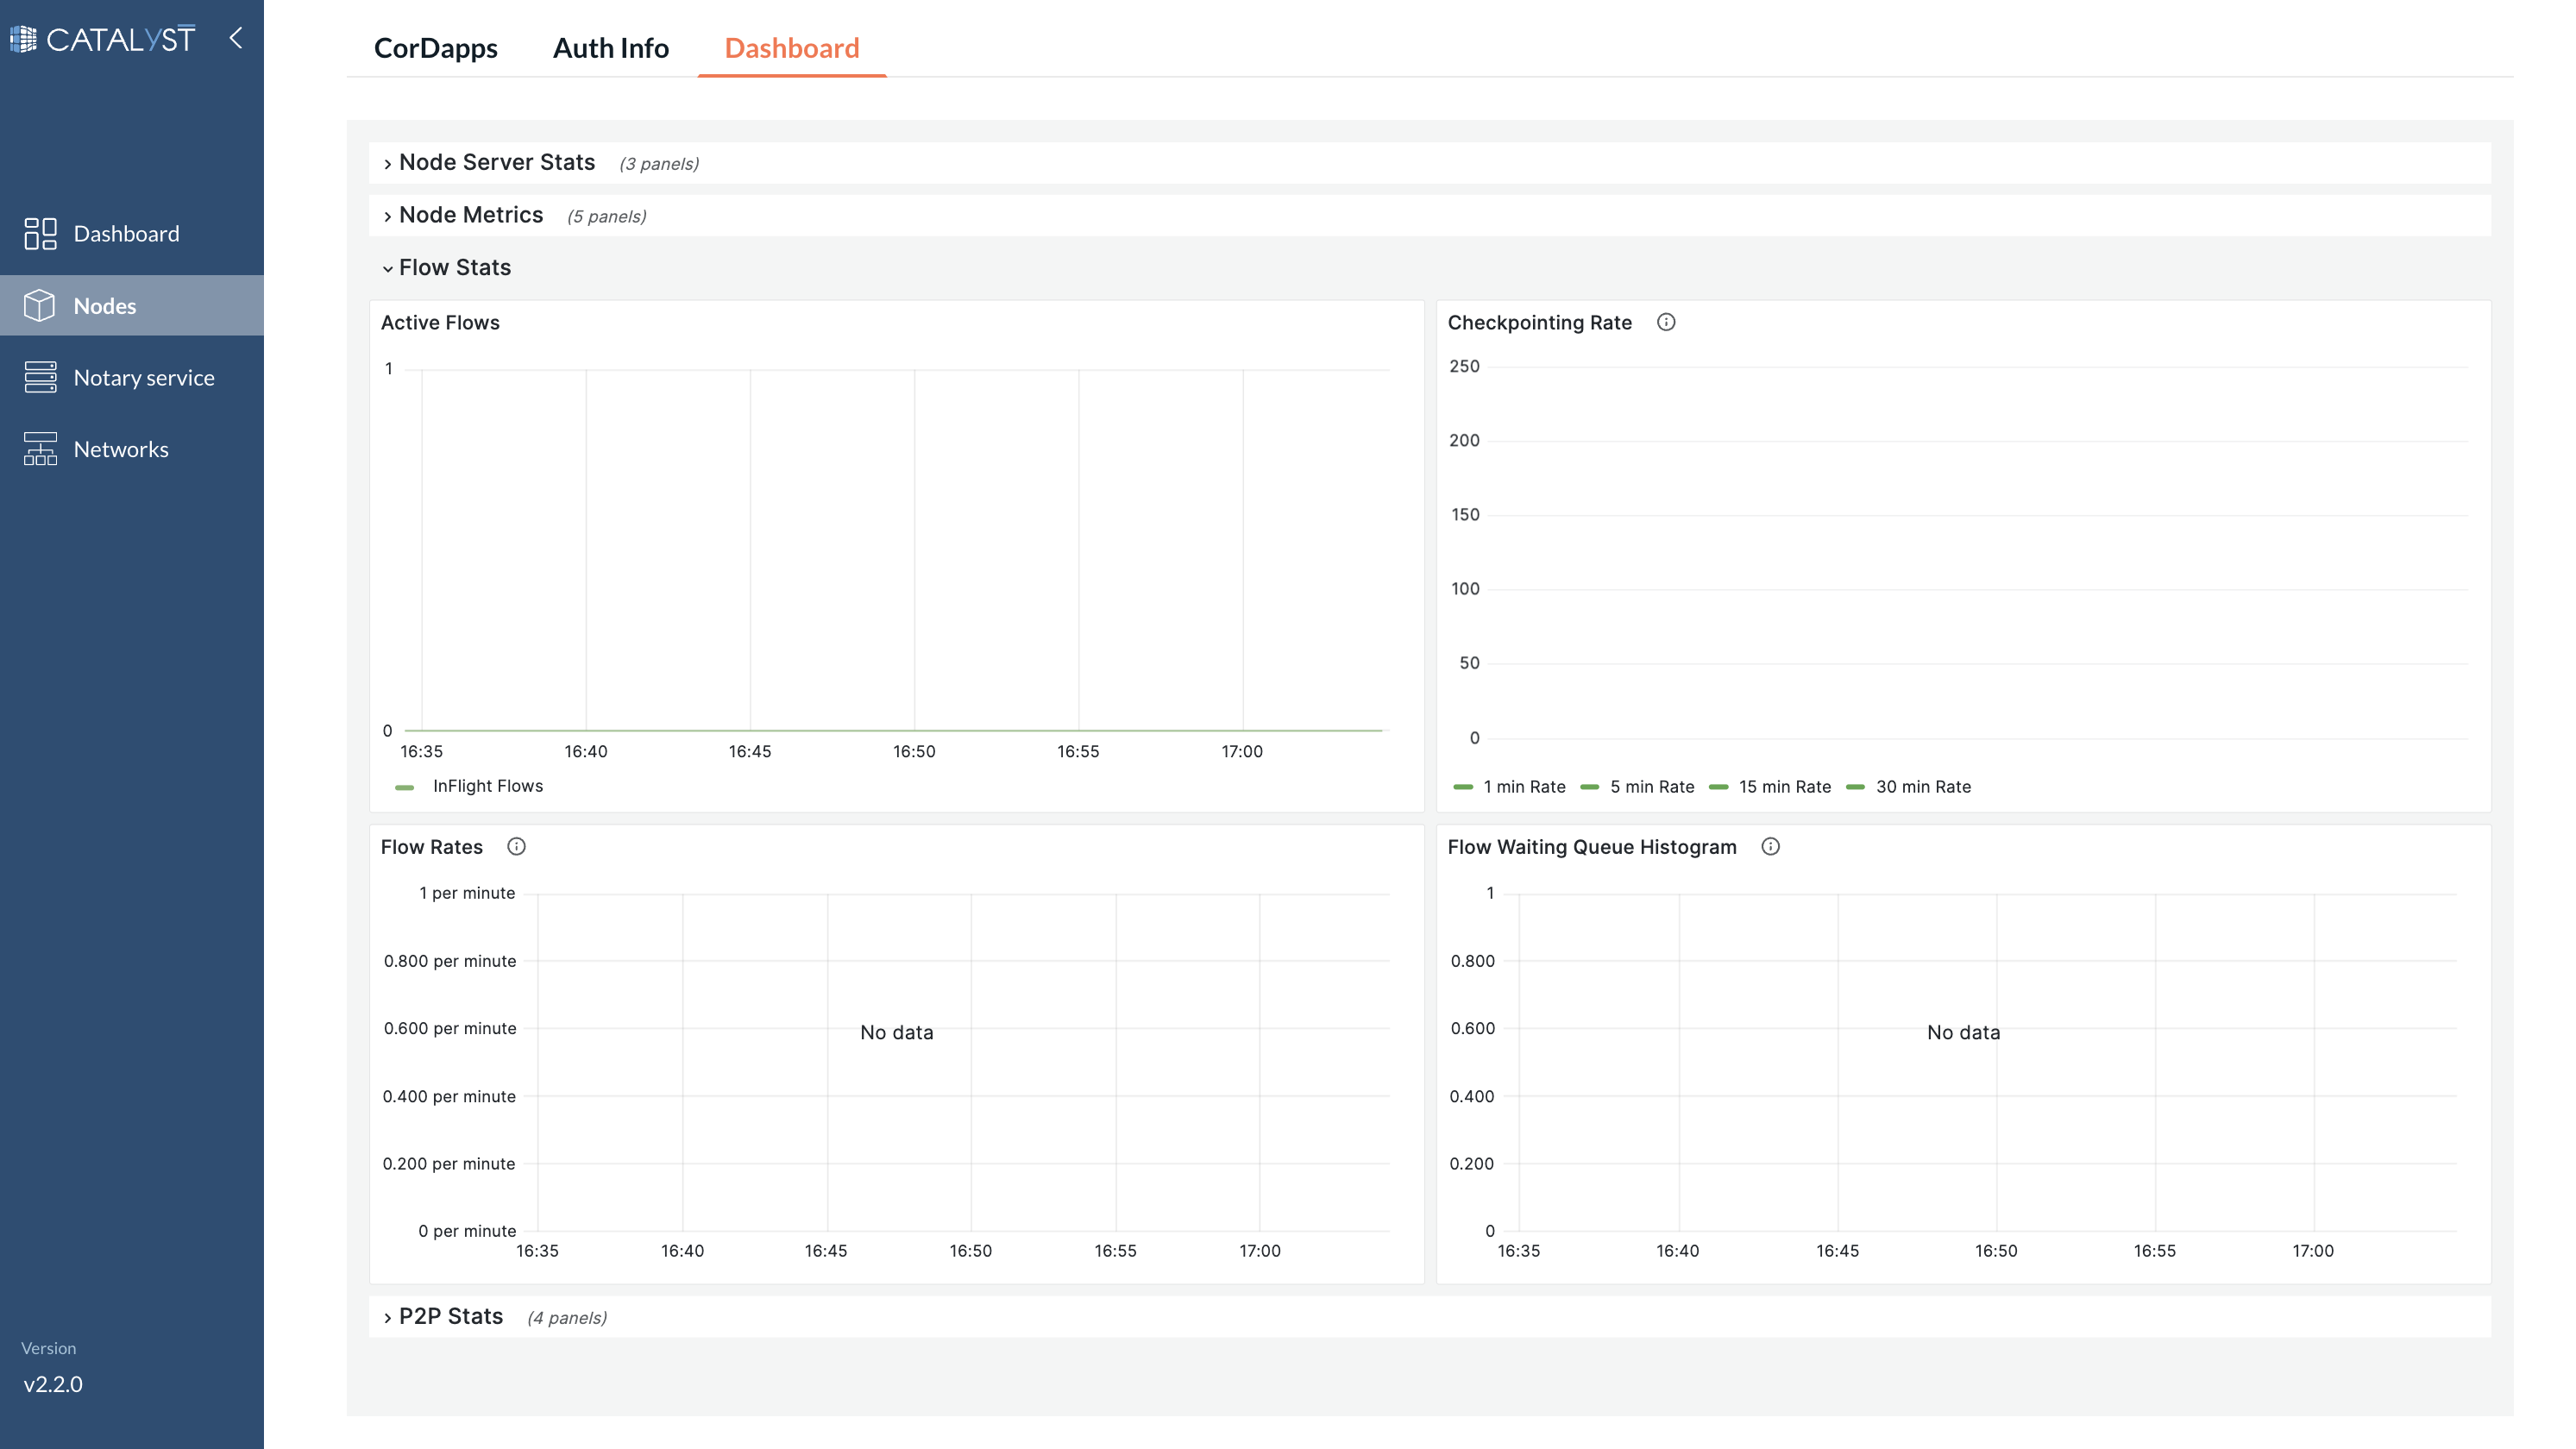
-
Active Flows: The current number of active flow processes being executed by the node.
-
Checkpointing Rate: The frequency at which the node is checkpointing flow processes.
-
Flow Rates: Provides metrics on flow process initiation, progression, and completion rates.
-
Flow Waiting Queue Histogram: A distribution graph showing the number of flows waiting to be processed, offering a visual insight into flow traffic and queuing.
P2P Stats
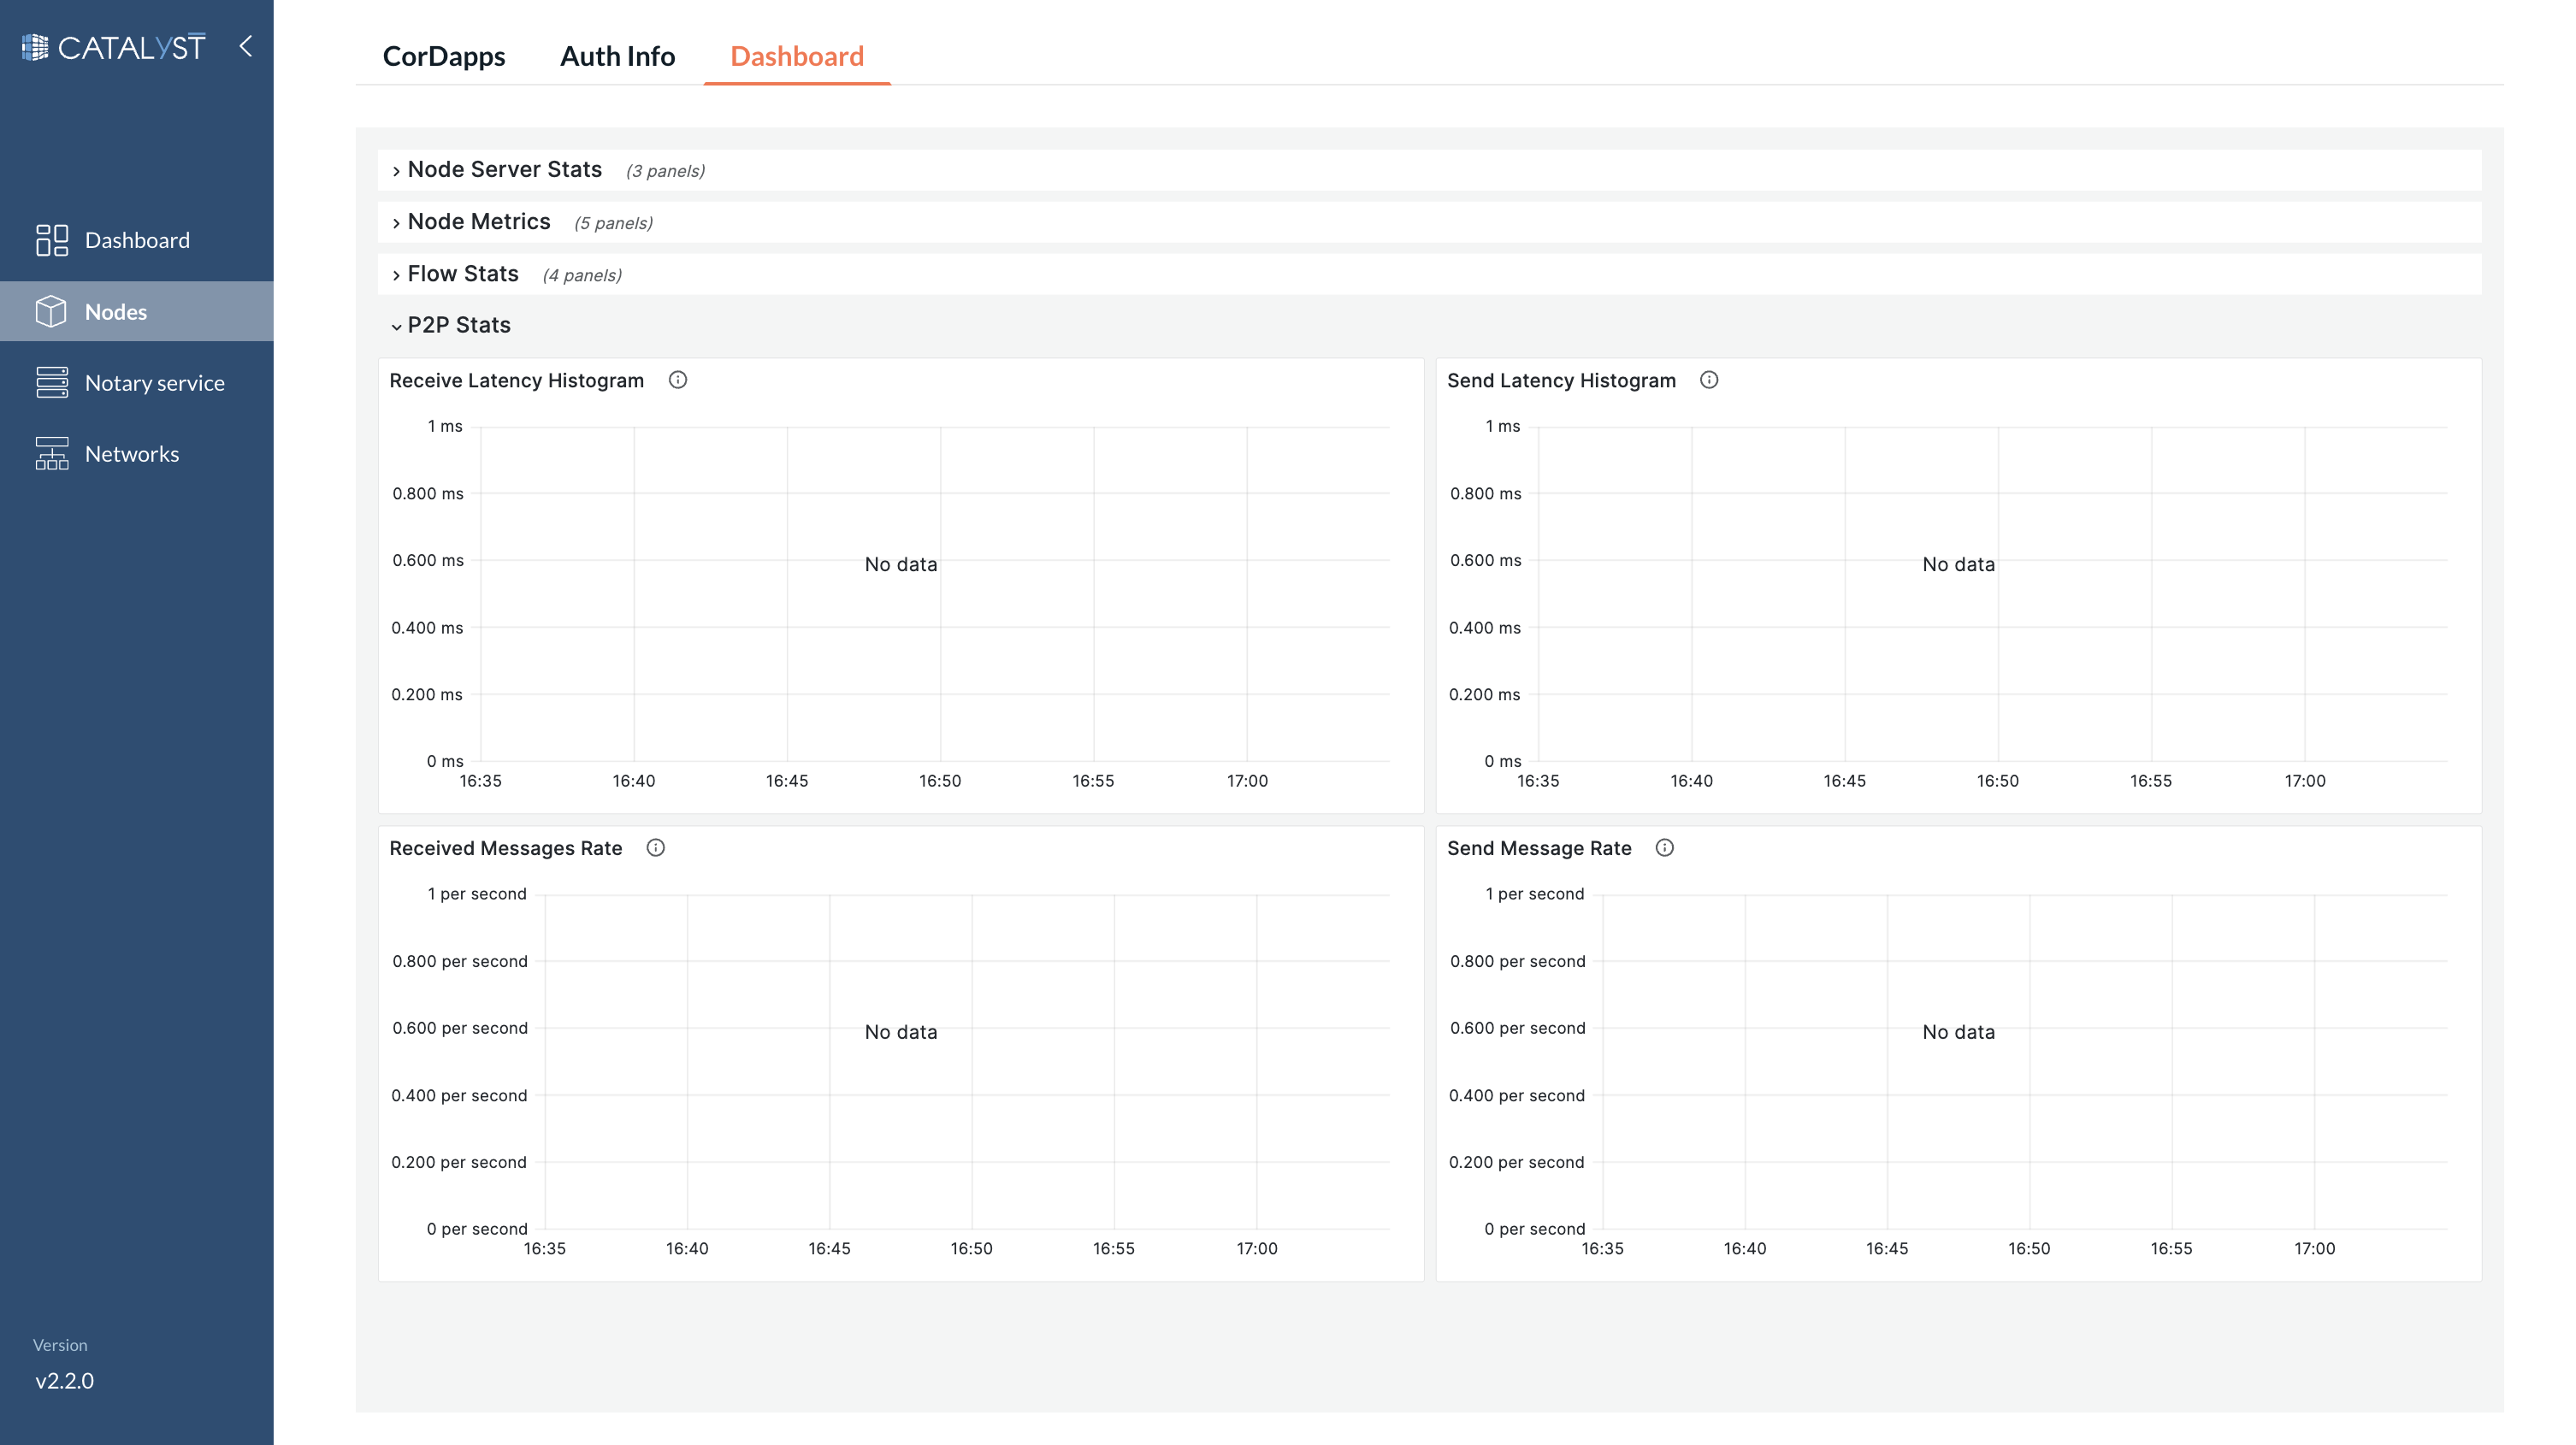
-
Receive Latency Histogram: Visual representation of the latency distribution for receiving messages.
-
Send Latency Histogram: Histogram showcasing the distribution of latencies for sending messages.
-
Received Messages Rate: The rate at which messages are being received by the node.
-
Send Message Rate: The rate at which the node is sending messages to peers.