Logging
This page explains how Catalyst provides access to logs for all running validator components directly from the user interface. Logs are retrieved from the Kubernetes API and displayed per component, with each entry including a Kubernetes-provided timestamp.
Component Logs
Catalyst displays logs for all running components on their main page. The logs are fetched from the Kubernetes API.
How Logs Work
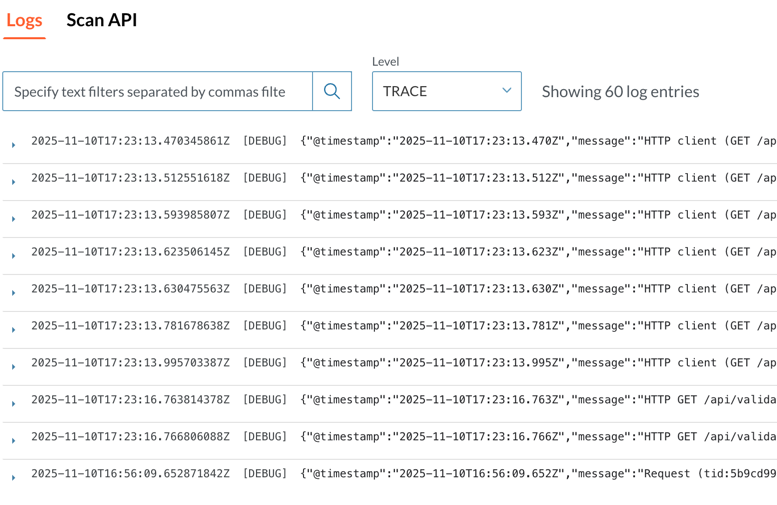
When you view a component, you see its log output. Each log entry includes a timestamp from the Kubernetes API.
Navigating Logs
Scroll up and down through the log output. Scroll down to see newer entries, scroll up to see older ones.
Log Formatting
Your logs can use any format. However, use level filtering, format your logs as JSON with a level field.
For example:
{"level": "error", "message": "Connection failed"}
{"level": "info", "message": "Service started"}
When your logs follow this format, you can filter by severity level (info, warning, error, etc.).